Bar Charts: owls
The Maths Bit!
In this exciting lesson, we will be learning how to present and interpret information in a bar chart. At the same time, we will be learning about the different owl species that can be found in the UK.
A bar chart is a simple and effective way to display information that uses rectangular bars of different heights.
There is a horizontal line (x axis) that shows you what is being investigated and a vertical line (y axis)with numbers on it.
Prior Learning: To interpret and construct simple pictograms, tally charts, block diagrams and tables.
Did you know?
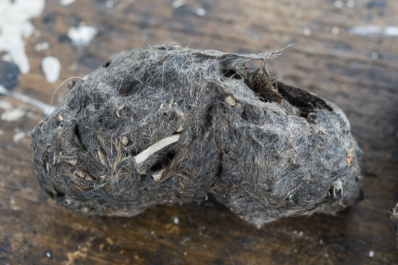
An owl pellet is a little ball of bone, fur and teeth that an owl ‘coughs up’ (regurgitates) through its beak. These body parts belong to the animals that an owl has eaten but has been unable to digest.
Whiteboard Challenges
The most common owls in the UK are tawny owls. This bar chart shows the different types of bone (and the numbers of each) that were found in the pellets of a tawny owl.
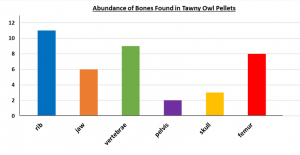
1) How many rib bones were in the tawny owl pellets?
2) How many more vertebrae bones than pelvis bones were there?
3) How many bones were in the owl pellets altogether?