Bar Charts: pond life
The Maths Bit!
In this exciting lesson, we will be learning how to present and interpret information in a bar chart. At the same time, we will be learning about the importance of ponds and the incredible wildlife that they can support.
A bar chart is a simple and effective way to display information that uses rectangular bars of different heights.
There is a horizontal line (x axis) that shows you what is being investigated and a vertical line (y axis)with numbers on it.
Prior Learning: To interpret and construct simple pictograms, tally charts, block diagrams and tables.
Did you know?
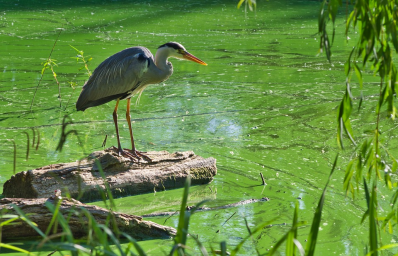
If there are fish in a pond, keep an eye out for kingfishers or even herons. However, birds aren’t just attracted to ponds because of the food opportunities. Sometimes they just need a drink or a bath!
Whiteboard Challenges
Invertebrates are animals without a backbone such as insects. This bar chart shows different numbers of invertebrate species in a large pond.
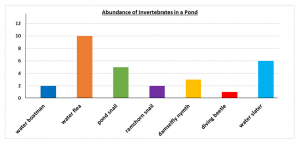
1) How many water fleas are in the pond?
2) How many more pond snails than diving beetles are in the pond?
3) How many water fleas, water slaters and pond snails are there combined?