Pictograms: fossils
The Maths Bit!
In this exciting lesson, we will be learning how to present and interpret information in a pictogram. At the same time, we will be learning about fossils such as ammonites, belemnites and trilobites.
A pictogram is a type of chart. It displays information using pictures or images to represent ‘real’ objects. Sometimes an image will represent a single object, and sometimes an image will represent more than one object (see ammonite pictogram opposite).
Prior Learning: To interpret and construct simple tally charts, block diagrams and tables.
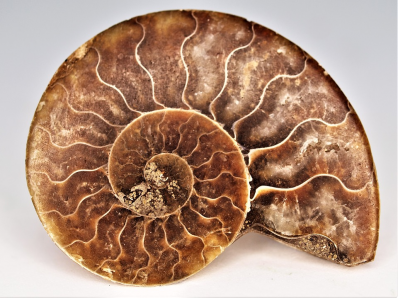
Inside an ammonite’s shell, there are numerous chambers, which the animal would have pumped air into and out of. This helped it to move upwards and downwards in the sea.
Whiteboard Challenges
This pictogram shows the number of ammonite fossils that a fossil hunter discovered on a stretch of Jurassic Coast over the course of 5 days in August 2021.
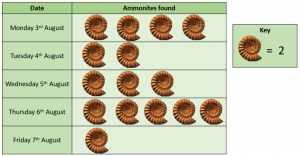
1) How many ammonites did the fossil hunter find on Thursday 6th August?
2) How many more ammonites did the fossil hunter find on Wednesday and Thursday than on Monday and Tuesday?
3) How many ammonites did the fossil hunter find altogether?