Statistics (pictograms, bar charts & line graphs): Desert Heat
Challenge level ⭐⭐
(designed for children with prior knowledge of the Year 3 and Year 4 programme of study)
Learning Objective
We are learning how to solve a natural world problem by using and applying our skills and knowledge of statistics, line graphs and bar charts.
Useful prior knowledge:
- To interpret and present data using bar charts
- To interpret and present data using line graphs
Credit: BBC One - Africa
Clip Description
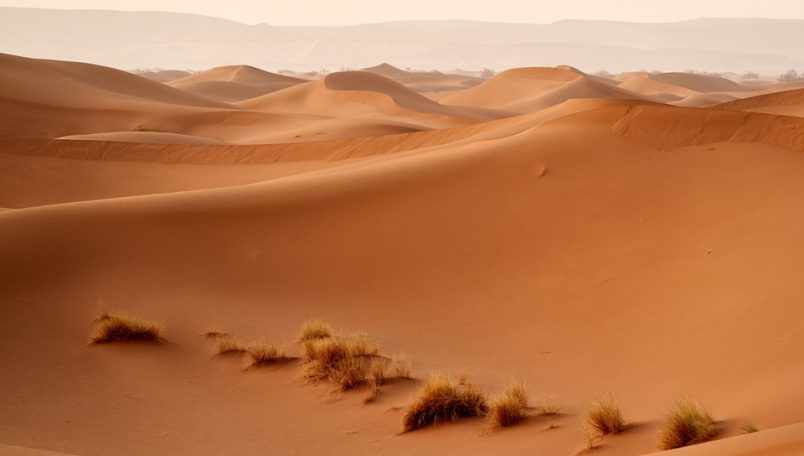
Deserts are the driest places on Earth. They receive less than 250 mm of rain in a single year. During the summer months, hot deserts (like the Sahara Desert and the Great Thar Desert) can regularly reach sizzling temperatures of over 50 °C in the day. However, temperatures at night regularly drop as low as – 4 °C. Despite being so dry, most hot deserts are full of life with plants and animals that have adapted to survive without much water.
In this fascinating clip, a remarkable plant called the resurrection plant is a true desert survivor. Despite being dead for over 100 years, it can miraculously come back to life when it finds water. How do you think this plant travels such great distances in its search for water? Watch the clip to find out.
Quick Whiteboard Challenge
In a region of the Sahara Desert, 240 mm of rainfall fell over the course of a year. All of this rain fell during the months of December, January, February and March.
How much rain might have fallen in each month if all of the amounts were multiples of 10?