KS2 Maths Lessons: Statistics (pictograms, bar charts & line graphs)
Spot the Mistake!
A boy called Kane looked at the bar chart opposite with great interest. (A mother fox and her three cubs had made their den in his back garden!)
Kane said, “I’ve used column subtraction to work out that there were 127 fewer foxes sighted than squirrels.”
What mistake did Kane make?
Did you know?
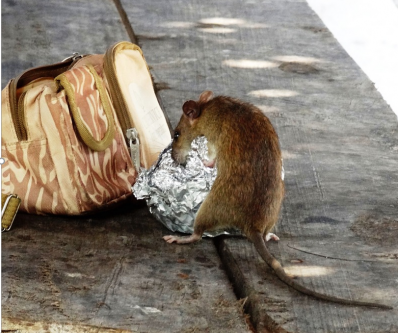
Towns and cities have everything that a rat needs to survive and thrive – food, warmth and shelter. They have an average lifespan of 1 – 3 years. Females can have up to five litters a year, with an average of 12 babies per litter. It is no wonder that there are so many of these rodents living in our urban areas!
Whiteboard Challenges
This bar chart shows the number of different urban animals that were sighted in a city called Bristol over the course of a year. (The values for each chart are given.)
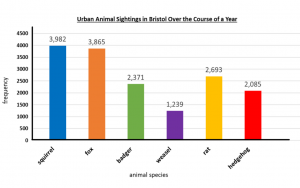
1) Can you list the animals in order from the least sighted to the most sighted?
2) How many more squirrels than foxes were sighted?
3) How many less hedgehogs than rats were sighted?