Statistics (pictograms, bar charts & line graphs): Wildlife Survey
Challenge level ⭐⭐
(designed for children with prior knowledge of the Year 3 and Year 4 programme of study)
Learning Objective
We are learning how to solve a natural world problem by using and applying our skills and knowledge of statistics and bar charts.
Useful prior knowledge:
- To interpret and present data using bar charts
Credit: CBBC - Newsround
Clip Description
There are many different kinds of wildlife that you can count such as birds, bugs and butterflies. Conservation organisations will often request help from the general public with these surveys as it is such an enormous undertaking. The information gathered can help scientists determine how a particular species is doing and the help that might need to be given.
In this fascinating clip, we learn that you can help scientists and conservationists by taking part in an annual garden birdwatch that is organised by the Royal Society for the Protection of Birds (RSPB). In a recent Big Garden Birdwatch, more than than 11,556,000 birds were spotted by children and adults. Which garden birds do you think we’ll see in the clip? Watch the clip to find out.
Quick Whiteboard Challenge
In a recent Big Garden Birdwatch, the house sparrow was the most spotted bird.
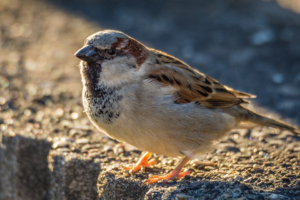
If a house sparrow lived for two and three quarter years in the wild, how many months did it live for?