Bar Charts: rock pools
The Maths Bit!
In this exciting lesson, we will be learning how to present and interpret information in a bar chart. At the same time, we will be learning about rock pools and the remarkable creatures that live in them.
A bar chart is a simple and effective way to display information that uses rectangular bars of different heights.
There is a horizontal line (x axis) that shows you what is being investigated and a vertical line (y axis)with numbers on it.
Prior Learning: To interpret and construct simple pictograms, tally charts, block diagrams and tables.
Did you Know?
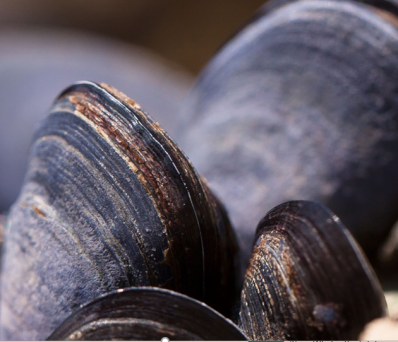
Mussels, limpets, barnacles and whelks belong to the mollusc family of animals. They can all be found clinging to the rocks in and around rock pools. When the tide comes in, they loosen their grip on the rocks so that they can feed. Mussels have a ‘beard’ or threads that stop them from being washed away by the sea’s strong currents and waves.
Scintillating Sentences
This bar chart shows the different numbers of mollusc species that were present in and around a Cornish rock pool.
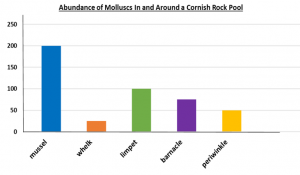
1) How many mussels were in and around the rock pool?
2) How many more mussels than periwinkles were there in and around the rock pool?
3) How many molluscs were there in total in and around this Cornish rock pool?