Pictograms: seed dispersal
The Maths Bit!
In this exciting lesson, we will be learning how to present and interpret information in a pictogram. At the same time, we will be learning about seeds and the different ways that they can be dispersed.
A pictogram is a type of chart. It displays information using pictures or images to represent ‘real’ objects. Sometimes an image will represent a single object, and sometimes an image will represent more than one object (see dandelion seed dispersal pictogram opposite).
Prior Learning: To interpret and construct simple tally charts, block diagrams and tables.
Did you know?
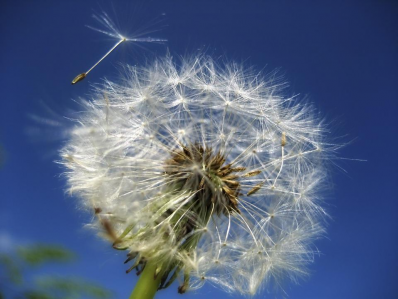
Plants such as dandelions often use wind to transport their seeds. Each dandelion seed comes with its own individual parachute. Only a slight wind will carry these seeds high into the sky. Some of these seeds may travel a distance of over 100 kilometres away from the parent plant!
Whiteboard Challenges
Each dandelion flower head holds between 100 and 200 seeds. This pictogram shows where the dandelion seeds of a flower head landed after being blown by the wind.
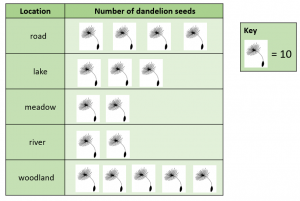
1) How many dandelion seeds landed in woodland?
2) How many dandelion seeds landed on land?
2) How many more dandelion seeds landed on land than landed on water?